Precision nitrogen analysis, explained.
No black boxes. Here's exactly how Messium measures nitrogen in your crop - and why existing tools fall short.
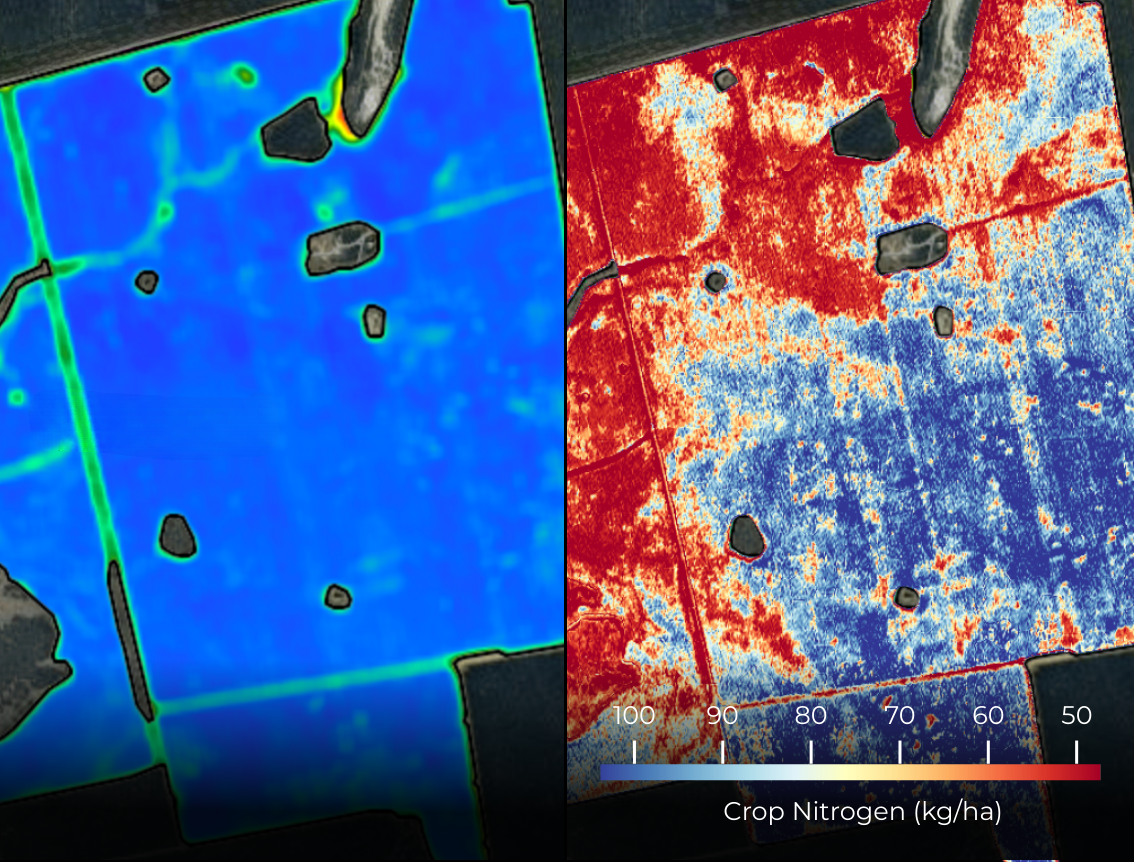
The same field, seen two ways.
On the left, a traditional NDVI map calls the whole field healthy and green. On the right, Messium reads the actual crop nitrogen - and the same field swings from 100 kg/ha down to 50. NDVI sees colour; Messium sees chemistry.
That hidden variation is where margin leaks away. The red zones are running short and will lose yield without a top-up; the blue zones already have all the nitrogen they can use, so anything more is wasted - lost to leaching or emissions rather than grain.
Seeing it is only the start - the real power is layering nitrogen against yield potential. Some zones read adequate today but sit on high-potential ground, so they'll turn hungry soon and repay every extra kilo. Others are already running short yet have lower potential and can't convert more nitrogen into grain, so feeding them just wastes money. That is where Messium goes beyond data to actionable insight: feed the parts that will pay, hold back where they won't, and put every kilo where it earns its keep.
Why NDVI can't tell you about nitrogen
NDVI is based on 2 wavelengths of light. It tells you a crop is green. It cannot tell you if it's hungry or overfed.
30,000 crop samples. Taken by hand. Across the world.
Messium has physically collected over 30,000 crop samples alongside simultaneous satellite passes - each sample lab-tested for nitrogen, paired with the hyperspectral image captured at that exact moment.
This dataset - built on wheat across many countries, growth stages and soil types - is what makes Messium's AI accurate at 90% lab equivalence. A standard no satellite product has previously achieved.
It is the equivalent of taking thousands of comprehensive lab tests every 5 metres in each field - for every farm, every week, with no equipment or slow lab work required.
A measurement is a moment. A model is the whole season.
Reading the nitrogen in your crop today is the start. Because we also see how the crop and soil have responded to every dose of fertiliser and every turn of weather so far, we can model what happens next - and what it means for your yield and protein at harvest.
Underpinned by decades of crop-physiology research - including nitrogen dilution curves and growth models - so each recommendation reflects how your variety, soil and season actually behave.
See it on your own fields.
We're happy to run a free trial and show you what Messium sees in your crop this season.
Book a Call →